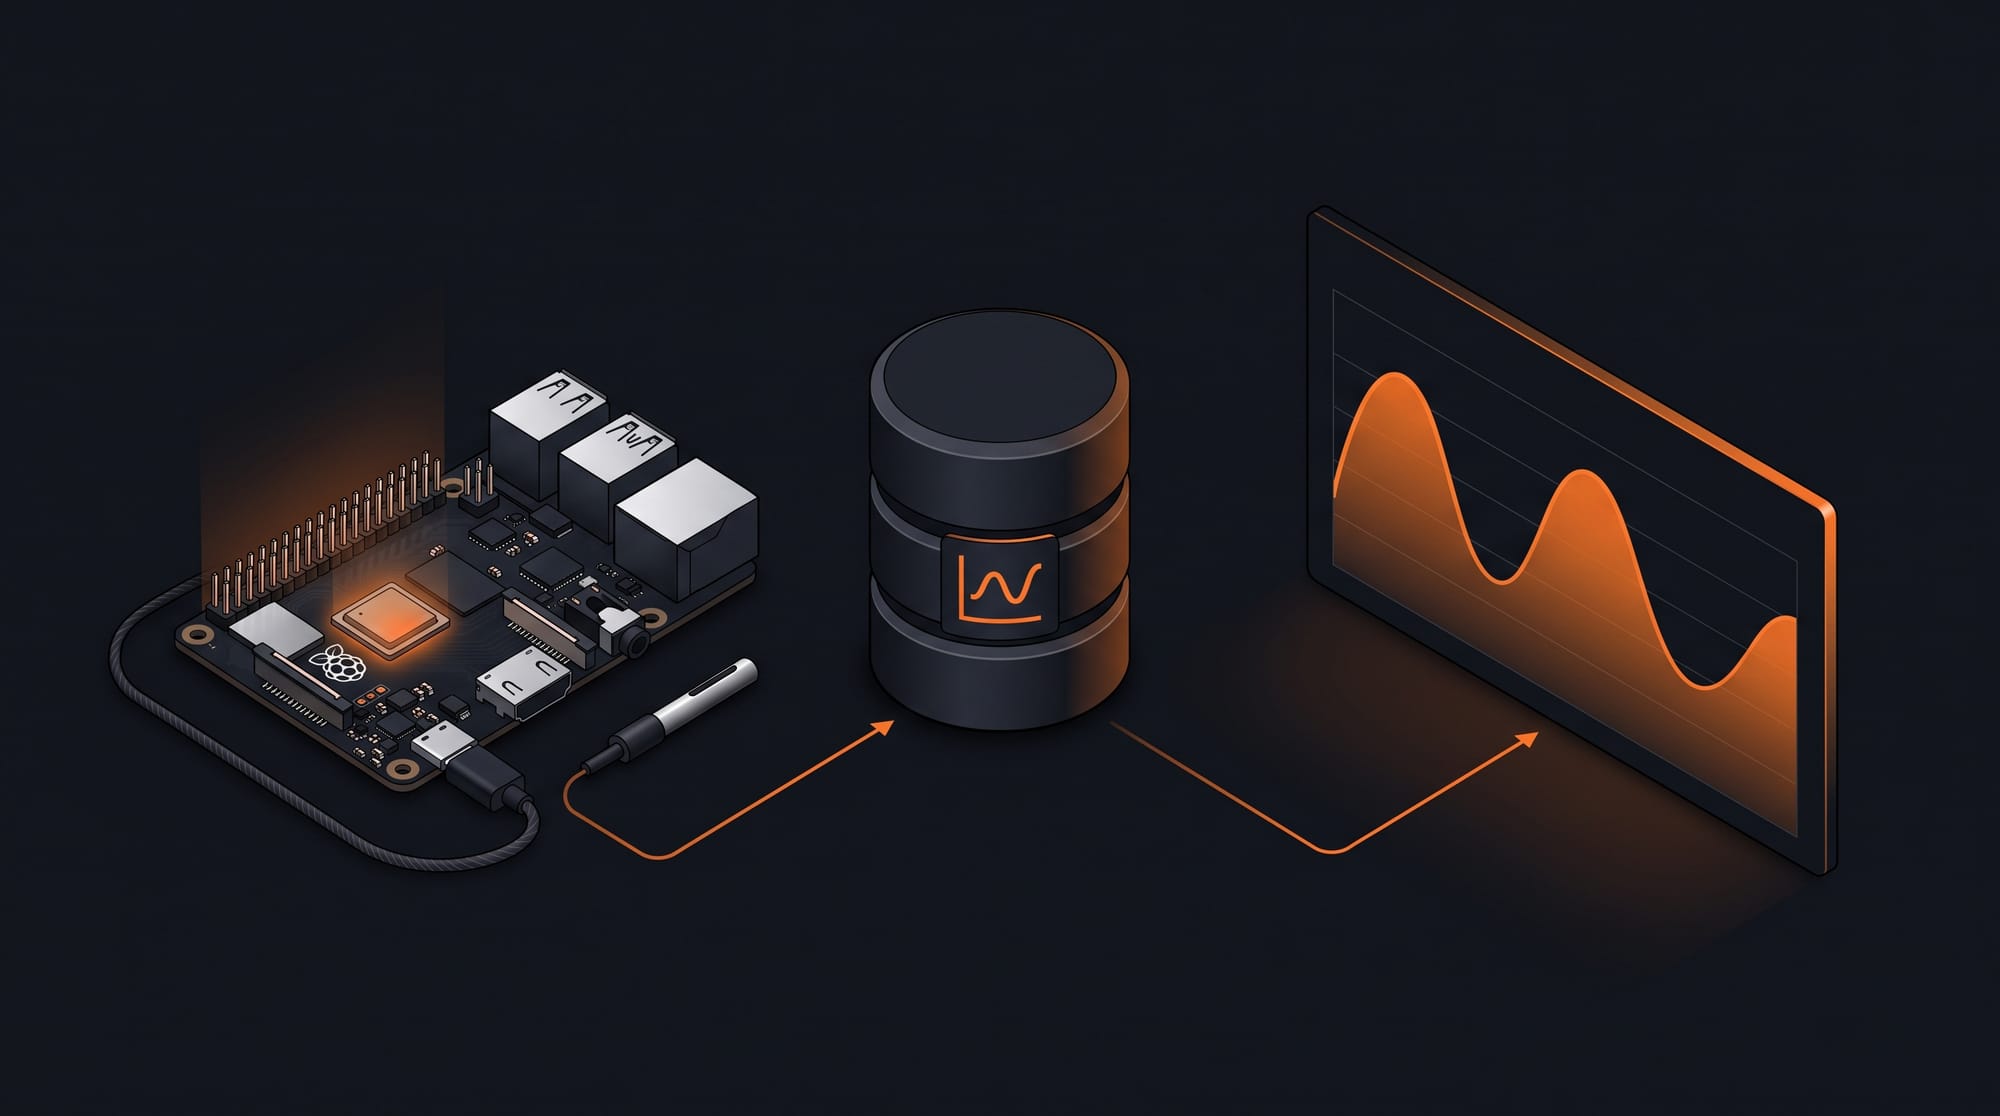
Monitor temperature with a Raspberry Pi and Grafana/InfluxDB on Docker
This article will detail all the hardware and software I have used to monitor the temperatures from a fridge and freezer to ensure they never go crazy. It comes with notifications as well in case of issues.
This article will detail all the hardware and software I have used to monitor the temperatures from a fridge and freezer to ensure they never go crazy. It comes with notifications as well in case of issues.
First things first, the hardware!
To be able to get this result, you will need:
- A Raspberry Pi with Raspbian, it will not consume a lot of power and CPU so Model 1 or 2 are enough
- One or more DS18B20 sensors (I'm using 2), depending on how many temperatures you want to capture. They are waterproof and coming with a 2 meters long wire so you can keep your Raspberry Pi far away and safe
- A breadboard, it will make your testing and wiring much easier
- A 4.7 kOhm resistor
- A server to run Docker with Grafana and influxDB, the Raspberry Pi's job is only about capture and push of the data to InfluxDB. You can also run everything on a Raspberry Pi but you will need a more performant one
Hardware installation
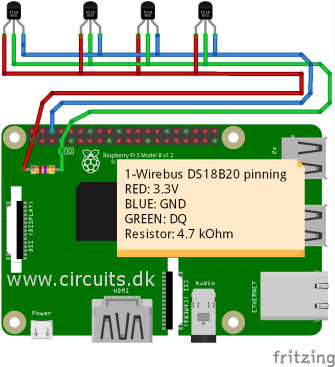
- As a first step, shut down your Raspberry Pi and plug the sensors and resistor accordingly to the schema above
- Open raspi-config with
sudo raspi-config - Select
Interfacing Options - Highlight
1-wireand set it toYesthen confirm withSelect - Reboot your Raspberry Pi with
sudo reboot
Sensors configuration
Now we will check if the Raspberry Pi recognize the sensors and can capture temperature
Sensors requirements
- You first need to register all the sensors you have plugged to the GPIO4, run
sudo modprobe w1-gpioso the Raspberry Pi is aware of it - Now, tell to the Raspberry Pi it can measure temperature on the 1-Wire system with
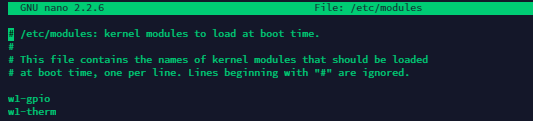
sudo modprobe w1-therm - It's important to load these 2 modules automatically on next boot. For that purpose, edit the modules file with
sudo nano /etc/modulesand add insidew1-gpioandw1-thermlike below - Save with Ctrl+X and Y
Testing the sensors
You need to ensure the sensors are capturing the temperature correctly.
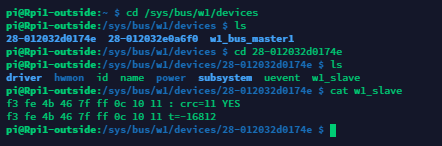
- Browse the 1-wire devices folder with
cd /sys/bus/w1/devices - List all devices with
ls. The DS18B20 sensors start with28-followed by the serial number of the sensor - Enter in one of the sensors directory and read the file
w1_slavewithcd 28-yyyy && cat w1_slave(replace yyyy by your sensor's serial number) - The value you will see at the end of the second line is the current temperature in degrees Celsius (you need to divide it by 1000, t=-16812 means -16.812°C)
- The first line contains a CRC, if the value is not YES, you might have a defect in your sensor or in its wiring
Prepare InfluxDB and Grafana to receive the Data
Build the stack
Let's build Grafana and InfluxDB as a docker-compose stack.
version: "2.3"
services:
  influxdb:
    image: influxdb:1.8-alpine
    container_name: monitoring-temperature-influxdb
    restart: always
    ports:
      - "8083:8083"
      - "8086:8086"
      - "8090:8090"
    environment:
      - PUID=1026
      - PGID=1000
      - TZ=Europe/Paris
    env_file:
      - /home/thelazyfox/docker/monitoring-temperature/influxdb/env.influxdb
    volumes:
      - /home/thelazyfox/docker/monitoring-temperature/influxdb/data:/var/lib/influxdb

  grafana:
    image: grafana/grafana
    container_name: monitoring-temperature-grafana
    restart: always
    ports:
      - "3000:3000"
    links:
      - influxdb
    volumes:
      - /home/thelazyfox/docker/monitoring-temperature/grafana/data:/var/lib/grafana
    environment:
      - PUID=1026
      - PGID=1000
      - TZ=Europe/Paris
      - GF_RENDERING_SERVER_URL=http://10.1.1.11:8123/render
      - GF_RENDERING_CALLBACK_URL=http://10.1.1.11:3000/
      - GF_LOG_FILTERS=rendering:debug
      - GF_INSTALL_PLUGINS=grafana-clock-panel,briangann-gauge-panel,natel-plotly-panel,grafana-simple-json-datasource
      - GF_AUTH_ANONYMOUS_ENABLED=true
      - GF_AUTH_ANONYMOUS_ORG_NAME=Home
    labels:

  grafana-image-renderer:
    image: grafana/grafana-image-renderer
    container_name: monitoring-temperature-grafana-image-renderer
    restart: always
    ports:
      - "8123:8081"
    environment:
      - PUID=1026
      - PGID=1000
      - TZ=Europe/Paris
      - IGNORE_HTTPS_ERRORS=true
      - LOG_LEVEL=debug
      - RENDERING_DUMPIO=true
      - RENDERING_MODE=default
- ENABLE_METRICS=truePlease remember to create all folders and files before trying to launch your docker-compose.
How does it look like on my server:
monitoring-temperature/
      |_ docker-compose.yaml
      |_ influxdb/
          |_ env.influxdb/
          |_ data/
      |_ grafana/
          |_ data/
Few notes regarding the stack:
grafana-image-rendereris used to integrate charts screenshot in the notificationsgrafana-image-rendererIP and port must be updated intoGF_RENDERING_SERVER_URLenvironment variable of grafana service- Grafana's IP and port must be updated into
GF_RENDERING_CALLBACK_URLenvironment variable of grafana service
And now, launch your docker-compose file with the following command cd monitoring-temperature && docker-compose up -d
Configure InfluxDB
It's time to create your InfluxDB database.
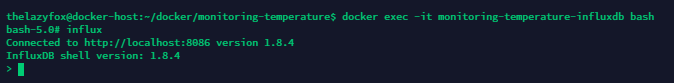
- Enter in your container with
docker exec -it monitoring-temperature-influxdb bash - Open InfluxDB shell with
influx - Create your database named "temp_logger_db" with
CREATE DATABASE temp_logger_db - Confirm it was successfully created by running
SHOW DATABASES - You can now enter
exitandexitagain to resume
Configure Grafana
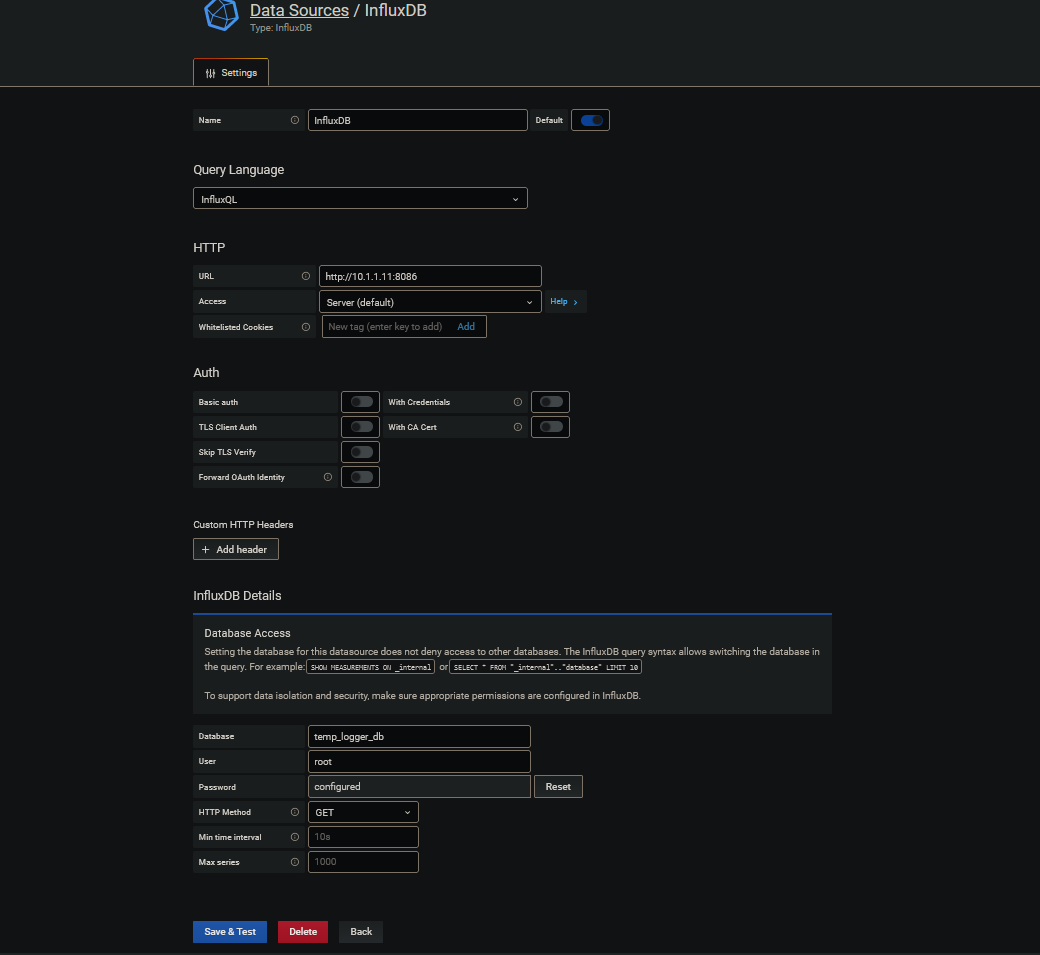
Grafana is accessible on port 3000, login with the default account admin:admin to link InfluxDB as a data source into Grafana.
- Open Settings
- Select "Data Sources" tab
- Click on "Add data source"
- Search and select "InfluxDB"
- Configure as below (Server URL, Database name and credentials)
Capture data with Python3 on Raspberry Pi
InfluxDB is ready and Grafana is connected to InfluxDB. Now it's time to go back on your Raspberry Pi to capture sensors' data from the files we saw before and inject them into InfluxDB.
Install dependencies
You need to install python3 and its influx library with sudo apt-get install python3 python3-pip && pip install influxdb
Create the script
- To capture the data, you have to create the python script below with
sudo nano templogger.py - Replace the sensors serial numbers on line 17 and integrate your InfluxDB information on line 20 to 23 and save
- Test the script by running
/usr/bin/python3 /home/pi/templogger.py -db=temp_logger_db -sn=data - You should see your temperatures
# -*- coding: utf-8 -*-
import os
import glob
import argparse
import time
import datetime
import sys
from influxdb import InfluxDBClient

os.system('modprobe w1-gpio')
os.system('modprobe w1-therm')

base_dir = '/sys/bus/w1/devices/'
device_folders = glob.glob(base_dir + '28*')

# List of temperature sensors from base_dir. Add as much as you want.
sensors=['28-012032d0174e', '28-012032e0a6f0']

# InfluxDB parameters
host = "10.1.1.11"
port = 8086
user = "root"
password = "root"

def get_args():
    parser = argparse.ArgumentParser(description='Push Celsius temperatures from DS18B20 sensors to an Influx database.')
    parser.add_argument(
        '-db', '--database', type=str, help='Database name', required=True)
    parser.add_argument(
        '-sn', '--session', type=str, help='Session', required=True)
    now = datetime.datetime.now()
    parser.add_argument(
        '-rn', '--run', type=str, help='Run number', required=False,
        default=now.strftime("%Y%m%d%H%M"))

    args = parser.parse_args()
    db_name = args.database
    run_no = args.run
    session = args.session
    return db_name, session, run_no

def read_temperature_raw(device_file):
    f = open(device_file, 'r')
    lines = f.readlines()
    f.close()
    return lines

def read_temperature(device_file):
    lines = read_temperature_raw(device_file)

    # Wait for the file to be available with a valid CRC
    while (not lines) or (lines[0].strip()[-3:] != 'YES'):
        time.sleep(0.2)
        print ("Retrying...")
        lines = read_temperature_raw(device_file)

    # Get the temperature value from the file
    equals_pos = lines[1].find('t=')

    # Convert to Celsius and round to 1 decimal
    if equals_pos != -1:
        temperature_string = lines[1][equals_pos+2:]
        temperature = float(temperature_string) / 1000.0
        temperature = round(temperature, 1)

    return temperature

def get_data_points():
    # Go through all sensors to get the temperature
    for sensor in range (len(sensors)):
        device_file=device_folders[sensor]+ '/w1_slave'
        sensors[sensor] = read_temperature(device_file)
        print (device_file,sensor,sensors[sensor])
    timestamp=datetime.datetime.utcnow().isoformat()

    # Create Influxdb datapoints
    datapoints = [
        {
            "measurement": session,
            "tags": {"runNum": run_no,},
            "time": timestamp,
            "fields": {"temperature 1":sensors[0],"temperature 2":sensors[1]}
        }
        ]
    return datapoints

# Get values from arguments
db_name, session, run_no = get_args()
print ("Session: ", session)
print ("Run No: ", run_no)
print ("DB name: ", db_name)

# Initialize the Influxdb client
client = InfluxDBClient(host, port, user, password, db_name)

# Collecting and pushing data
datapoints=get_data_points()
bResult=client.write_points(datapoints)
print("Write points {0} Bresult:{1}".format(datapoints, bResult))
Run it automatically as a cron job
You want to capture the data as soon as the Raspberry Pi is turned on and on a regular basis, for that purpose, we need to create a cronjob.
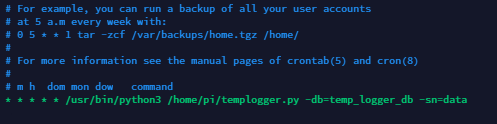
- Open the crontab with
crontab -e - Add this line to run the script every minute:
* * * * * /usr/bin/python3 /home/pi/templogger.py -db=temp_logger_db -sn=data
If you need help with crontab to change the frequency, you can use cronhub - Update the script's path and the database name if needed
- Save with Ctrl+X and Y
- It's over!
Run it as a service with systemd
As an alternative, you can also manage your data capture with a systemd service. First you will need to slightly alter the script.
Adapt the script
Replace the section "Collecting and pushing data" from the previous script with this one:
# Collecting and pushing data
try:
     while True:
        datapoints=get_data_points()
        bResult=client.write_points(datapoints)
        print("Write points {0} Bresult:{1}".format(datapoints,bResult))
        time.sleep(60)

except KeyboardInterrupt:
print ("Program stopped by keyboard interrupt [CTRL_C].")Create and start the service
- Create the file with
nano /etc/systemd/system/templogger.service - Copy/Paste the service below and update the script's path and the database name if needed
- Save with Ctrl+X and Y
- Reload the list of systemd scripts with
sudo systemctl daemon-reload - Start the service with
sudo systemctl start templogger.service - Enable it so it runs automatically on boot with
sudo systemctl enable templogger.service
[Unit]
Description=Temp Logger
After=multi-user.target

[Service]
Restart=on-failure
RestartSec=5s
Type=idle
User=pi
Group=pi
ExecStart=/usr/bin/python3 /home/pi/templogger.py -db=temp_logger_db -sn=data

[Install]
WantedBy=multi-user.target
✌🏼 By crontab or by service, your temperatures are now captured every 60 seconds in InfluxDB! You can now start building your Grafana Dashboard.
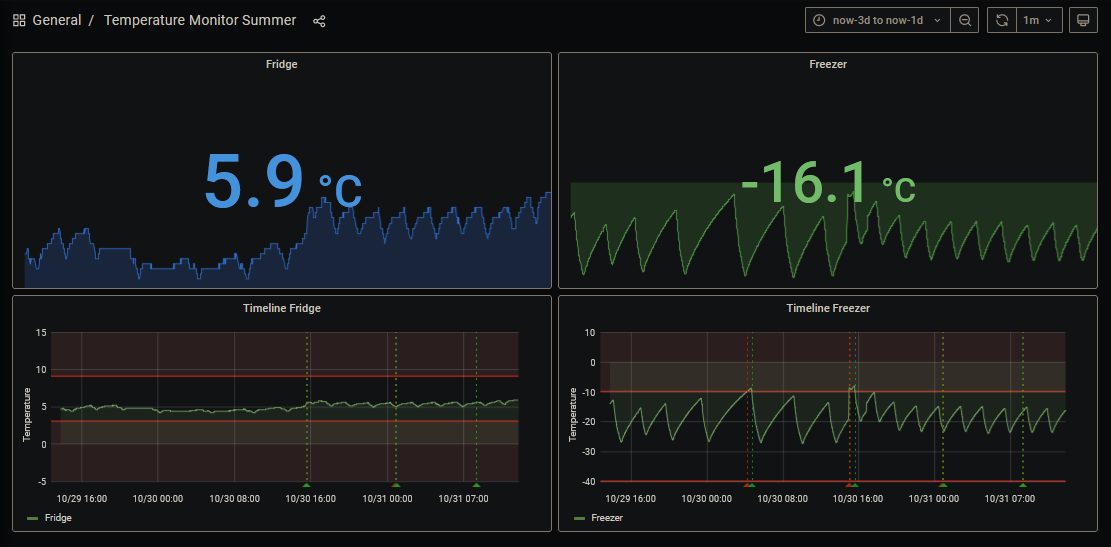
Start building your Grafana Dashboard
- Create a new Dashboard
- Add a new Panel and configure the Query as below
- Source
InfluxDBfromdefault, the dataset isdata(you can customize it by changing the value of-snin the command) - Select
field(temperature1)(you will see one value per sensor) - Format as
Time series - Save
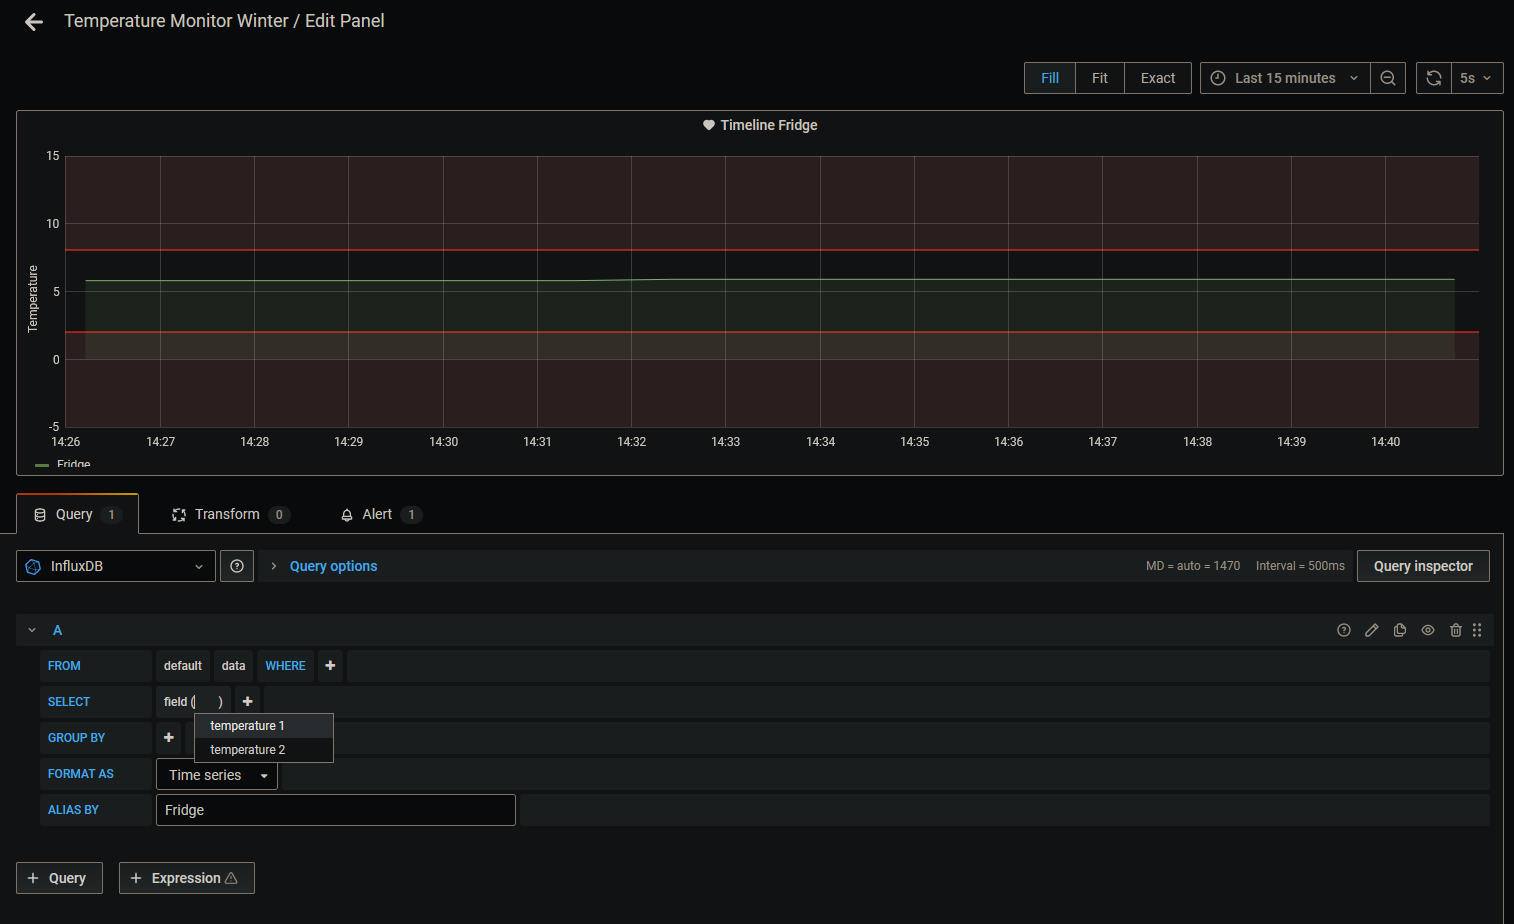
🎉 Congrats! Your Raspberry Pi is now capturing temperatures and pushing it in an InfluxDB available through Grafana!
Feel free to share your Dashboards and alerts on Discord!
Since I initially wrote this article, I have printed my own board to replace the breadboard. I've designed it on EasyEDA. I put it for download below, feel free to use it and print it with jlcpcb.com.